16.1: You Tell the Story
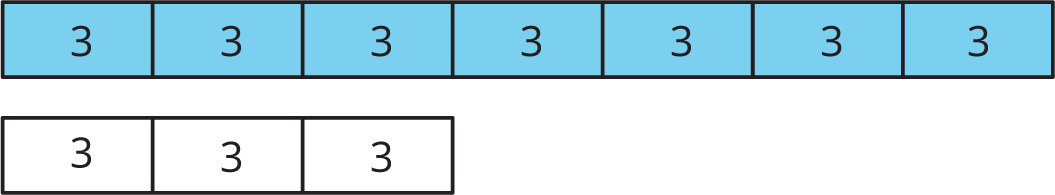
Describe a situation with two quantities that this tape diagram could represent.
Let’s compare all our strategies for solving ratio problems.
Describe a situation with two quantities that this tape diagram could represent.
Consider the problem: A teacher is planning a class trip to the aquarium. The aquarium requires 2 chaperones for every 15 students. The teacher plans accordingly and orders a total of 85 tickets. How many tickets are for chaperones, and how many are for students?
Solve this problem in one of three ways:

| kids | chaperones | total | |
|---|---|---|---|
| row 1 | 15 | 2 | 17 |
| row 2 | |||
| row 3 | |||
| row 4 | |||
| row 5 |
Use a tape diagram.

Use the digits 1 through 9 to create three equivalent ratios. Use each digit only one time.
$\boxed{\phantom{3}}:\boxed{\phantom{3}}$ is equivalent to $\boxed{\phantom{3}}\,\boxed{\phantom{3}}:\boxed{\phantom{3}}$ and $\boxed{\phantom{3}}\,\boxed{\phantom{3}}:\boxed{\phantom{3}}\,\boxed{\phantom{3}}$
Solve each problem, and show your thinking. Organize it so it can be followed by others. If you get stuck, consider drawing a double number line, table, or tape diagram.
When solving a problem involving equivalent ratios, it is often helpful to use a diagram. Any diagram is fine as long as it correctly shows the mathematics and you can explain it.
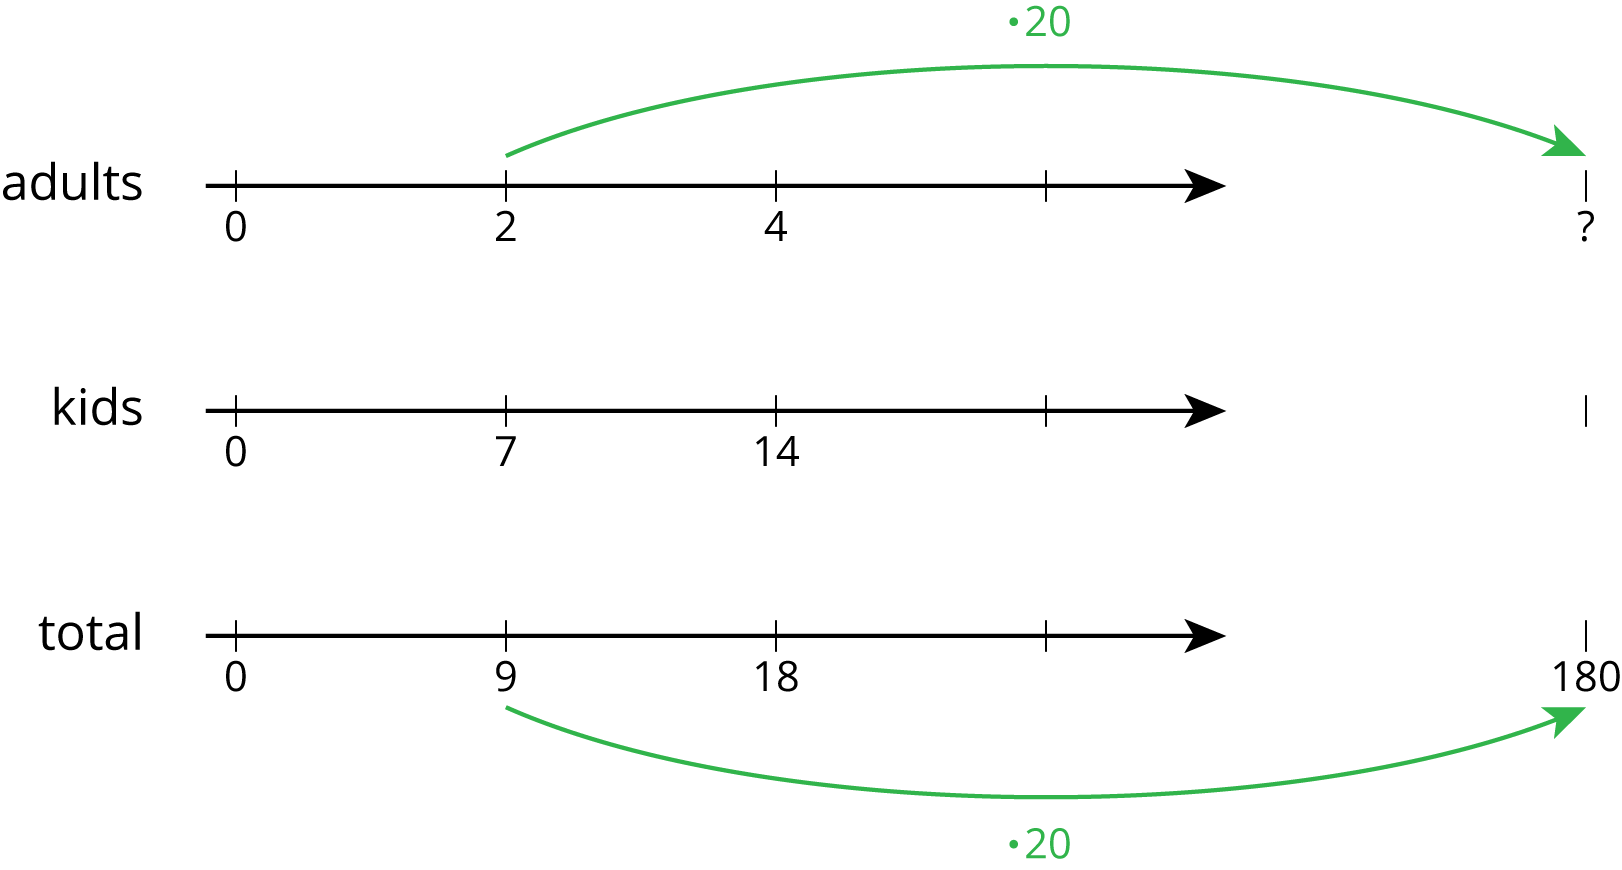
Let’s compare three different ways to solve the same problem: The ratio of adults to kids in a school is $2:7$. If there is a total of 180 people, how many of them are adults?
Tape diagrams are especially useful for this type of problem because both parts of the ratio have the same units (“number of people") and we can see the total number of parts.

This tape diagram has 9 equal parts, and they need to represent 180 people total. That means each part represents $180 \div 9$, or 20 people.

Two parts of the tape diagram represent adults. There are 40 adults in the school because $2\boldcdot 20 = 40$.
Double or triple number lines are useful when we want to see how far apart the numbers are from one another. They are harder to use with very big or very small numbers, but they could support our reasoning.
Tables are especially useful when the problem has very large or very small numbers.

We ask ourselves, “9 times what is 180?” The answer is 20. Next, we multiply 2 by 20 to get the total number of adults in the school.
Another reason to make diagrams is to communicate our thinking to others. Here are some good habits when making diagrams: