15.1: True or False: Multiplying by a Unit Fraction
True or false?
\frac15\boldcdot 45 = \frac{45} {5}
\frac15\boldcdot 20 = \frac14\boldcdot 24
42\boldcdot \frac16 = \frac16\boldcdot 42
486\boldcdot \frac{1} {12} = \frac{480} {12} + \frac{6} {12}
Let’s look at situations where you can add the quantities in a ratio together.
True or false?
\frac15\boldcdot 45 = \frac{45} {5}
\frac15\boldcdot 20 = \frac14\boldcdot 24
42\boldcdot \frac16 = \frac16\boldcdot 42
486\boldcdot \frac{1} {12} = \frac{480} {12} + \frac{6} {12}
A recipe for maroon paint says, “Mix 5 ml of red paint with 3 ml of blue paint.”
Suppose each cube represents 2 ml. How much of each color paint is there?
Red: _______ ml
Blue: _______ ml
Maroon: _______ ml
Suppose each cube represents 5 ml. How much of each color paint is there?
Red: _______ ml
Blue: _______ ml
Maroon: _______ ml
Suppose you need 80 ml of maroon paint. How much red and blue paint would you mix? Be prepared to explain your reasoning.
Red: _______ ml
Blue: _______ ml
Maroon: 80 ml
Solve each of the following problems and show your thinking. If you get stuck, consider drawing a tape diagram to represent the situation.
Create a visual display that includes:
Trade your display with another group, and solve each other’s problem. Include a tape diagram as part of your solution. Be prepared to share the solution with the class.
A tape diagram is another way to represent a ratio. All the parts of the diagram that are the same size have the same value.
For example, this tape diagram represents the ratio of ducks to swans in a pond, which is 4:5.

The first tape represents the number of ducks. It has 4 parts.
The second tape represents the number of swans. It has 5 parts.
There are 9 parts in all, because 4+5=9.
Suppose we know there are 18 of these birds in the pond, and we want to know how many are ducks.

The 9 equal parts on the diagram need to represent 18 birds in all. This means that each part of the tape diagram represents 2 birds, because 18\div9 = 2.
There are 4 parts of the tape representing ducks, and 4 \boldcdot 2=8, so there are 8 ducks in the pond.
A tape diagram can be used to represent a ratio between two quantities measured in the same units.
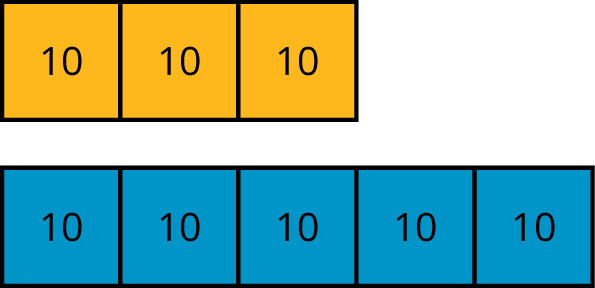
The tape diagram shows a ratio of 30 gallons of yellow paint to 50 gallons of blue paint.

A tape diagram is composed of one or more rectangles that are partitioned into equal parts. Each part represents a value. It can be any value, as long as the same value is used throughout.